US Policy & 2026 Midterms Atlas
An interactive map of the 2026 midterm results alongside county-level policy and price data
Project Overview
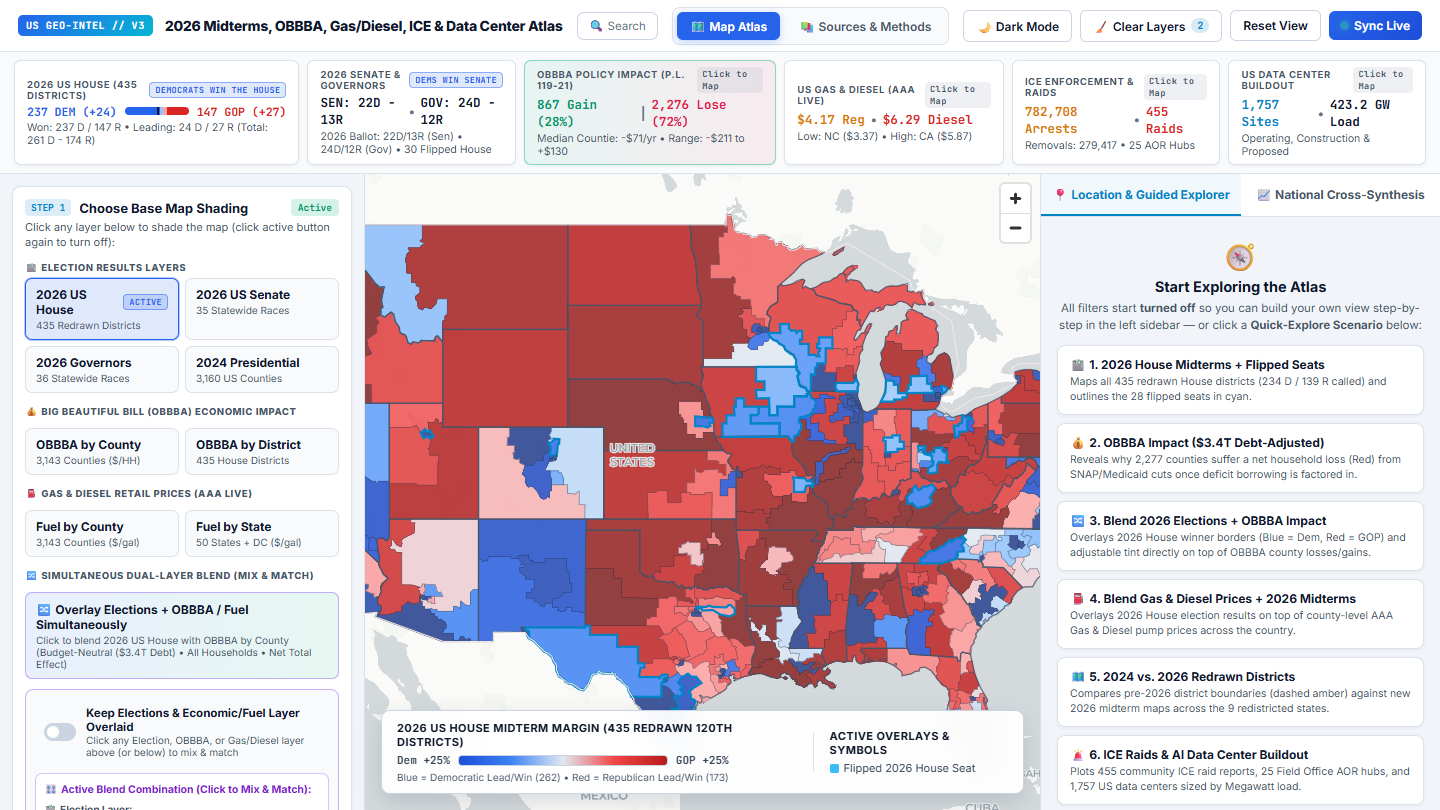
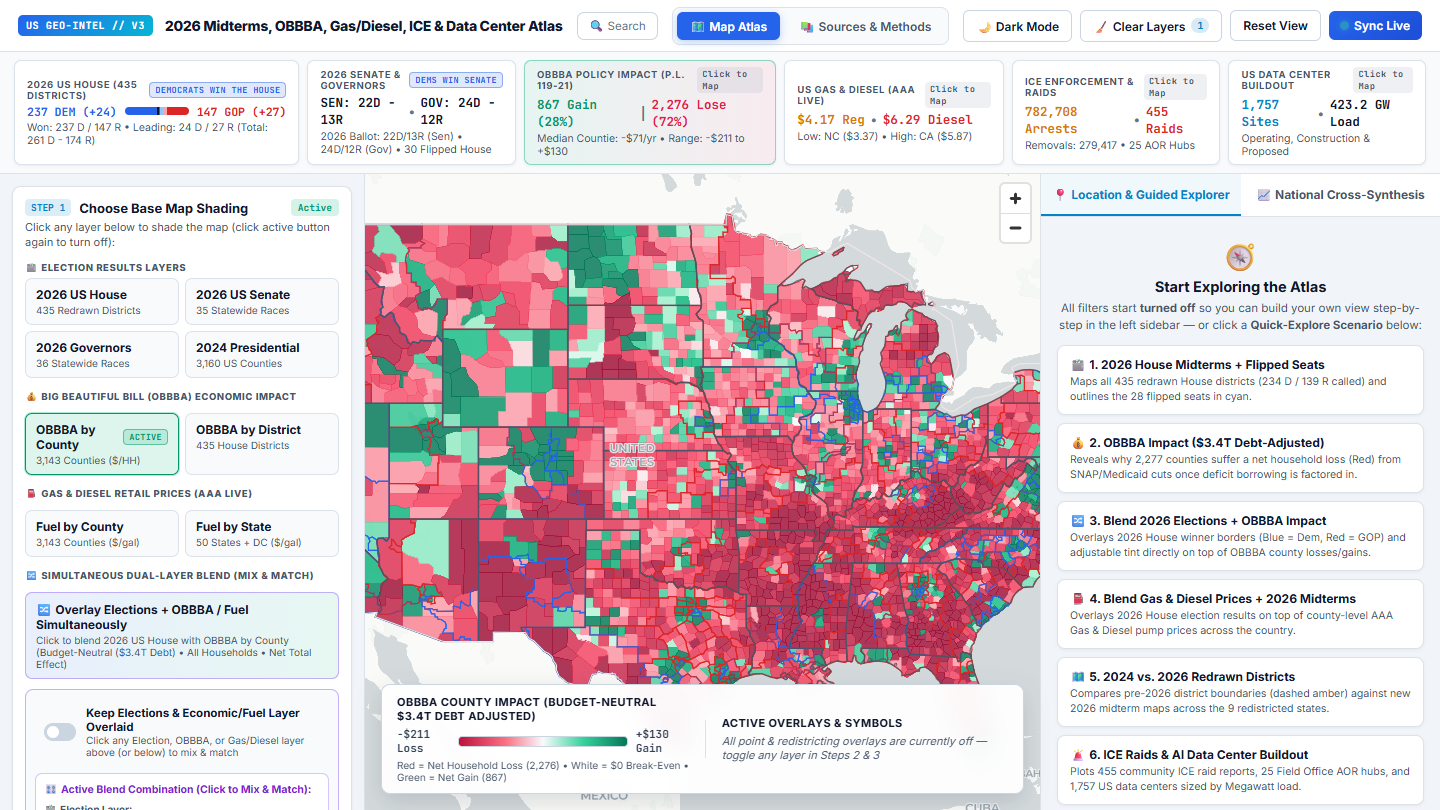
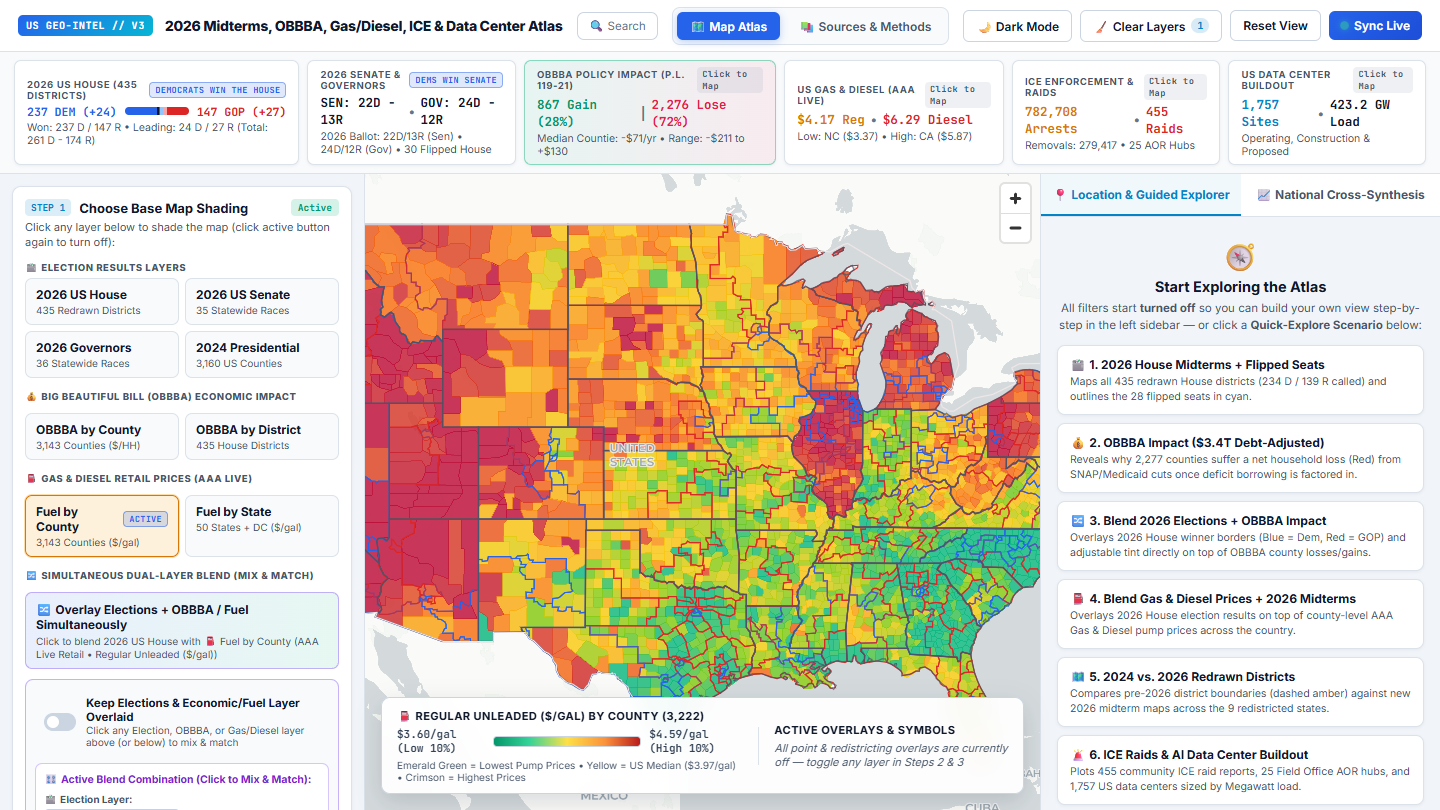
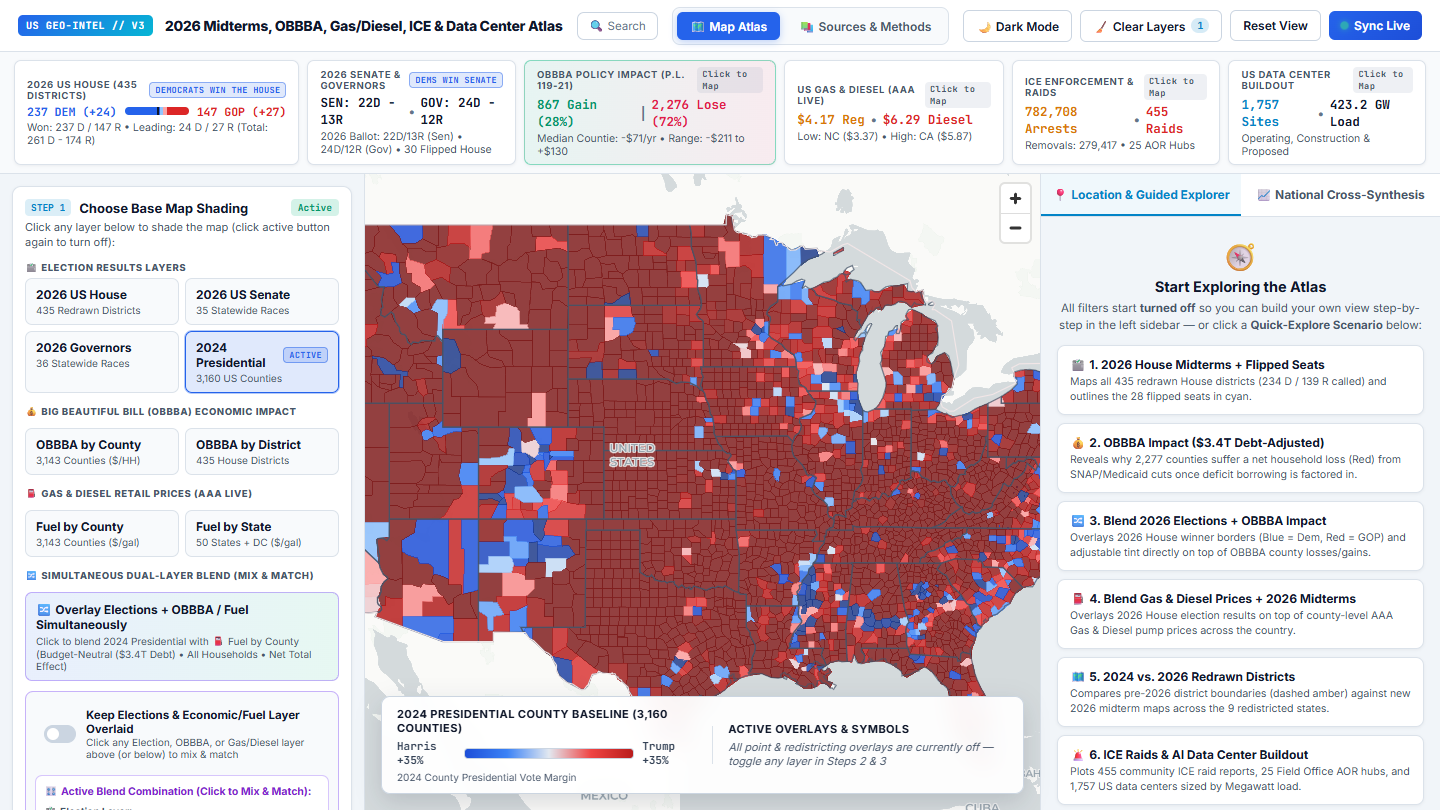
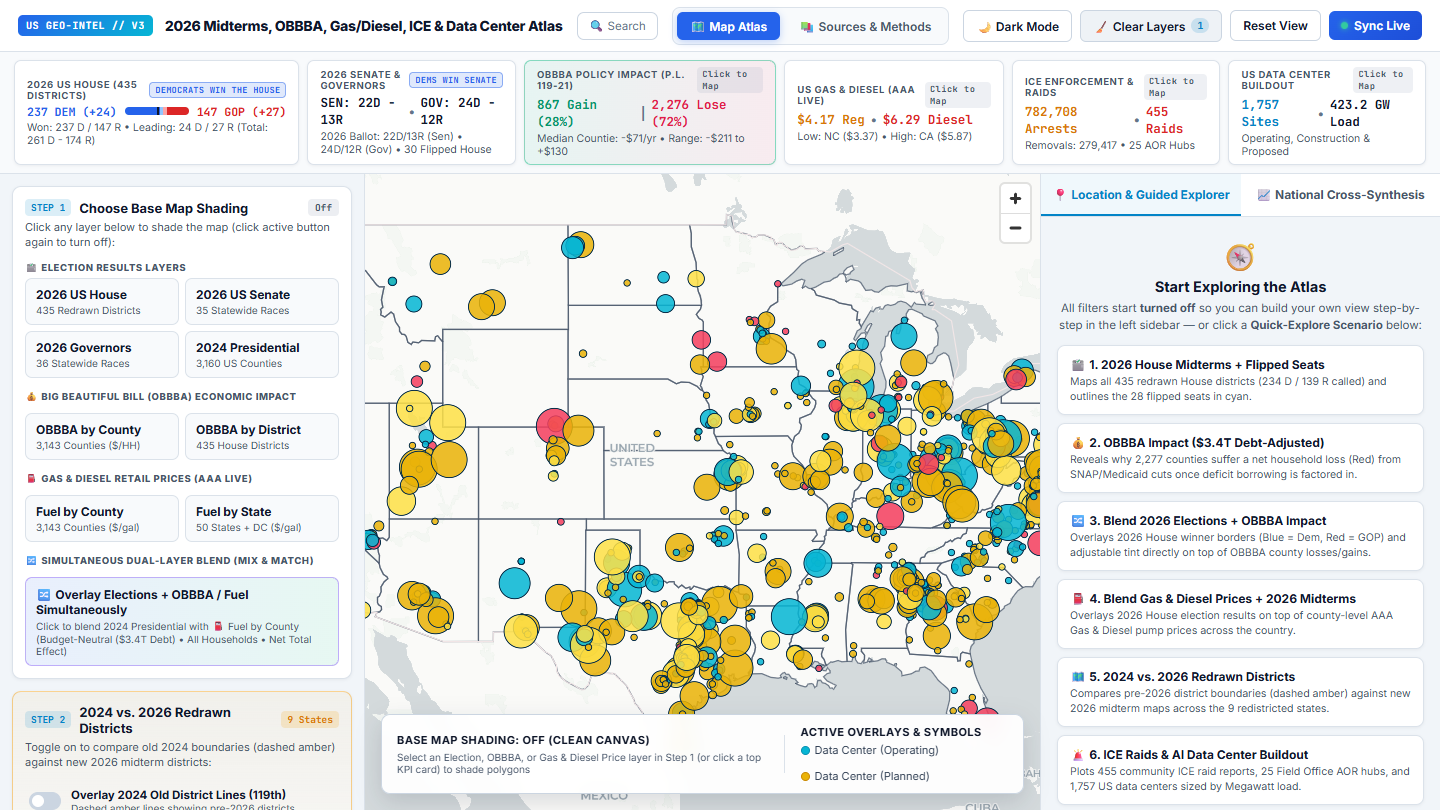
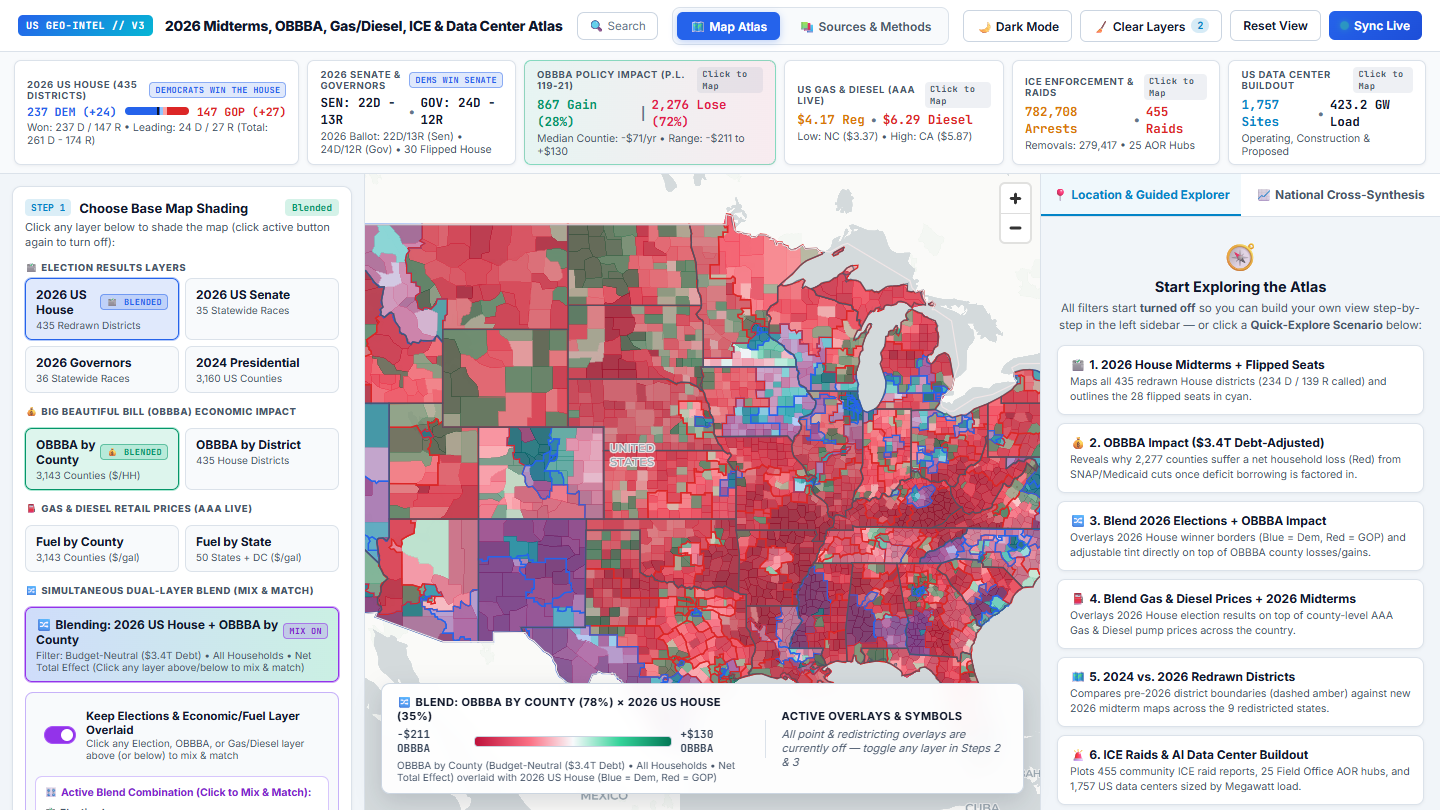
This atlas shows the November 2026 midterm results (435 House districts, 35 Senate races, and 36 governor's races) on one map with county-level data: the estimated household impact of the 2025 budget law known as the One Big Beautiful Bill Act, gas and diesel prices, immigration enforcement activity, and the build-out of data centers.
Each layer can be shaded on its own or blended with another, for example House results outlined over county-level household gains and losses. The pre-2026 district lines can be overlaid on the nine states that redrew their maps between elections, and a search box opens a local summary for any state, county, or district.
Behind the map is a Python pipeline that pulls each public dataset, cleans it, and joins everything on county and district codes: 3,143 counties, 435 districts, and 1,757 data-center sites. A Sources & Methods page documents where every layer comes from and how it is calculated, including a public election results feed, estimates built on Congressional Budget Office analysis, AAA fuel prices, the FracTracker Alliance data-center tracker, and Census boundaries.
The atlas is a static site built on MapLibre GL. Its figures are a snapshot of each source as of the last pipeline run.
Project Scope
- RoleDesigner & Developer
- PlatformWeb · MapLibre GL, Python data pipeline
- Research7 data layers · 3,143 counties · 435 districts
- LocationUnited States
- Years2026
Media Gallery